The question of inter-rater agreement comes up when we have multiple assessments of the same subject using the same scale. For example, rubric scores of student work with multiple raters. The point of using more than one judge of the material is to find out the extent to which they agree. Unfortunately, the existing statistics for doing this aren't of much help in understanding what's going on with the rubric ratings. There are a variety of measures, including Cohen's Kappa, Fleiss's Kappa, and several others. These are designed to assess agreement between raters, and comparing the nominal agreement with what we might find if the raters were just making assignments randomly. This is called "chance correction." I find that a single index is not very helpful, and although there are conditional versions out there, they are not easy to find or use.
So I created one that I like, and have found very useful. The technical notes are in this paper, which is a pretty good draft at this point. I created an online app do to all the hard work, and put the code on Github. (Note: on 12/30 I renamed the repo to reflect the actual name).
Here's an example of the output. It shows a three-point scale, from 0 to 2, with comparisons between each response and each other response. The lower right graph is 1 versus 2, which shows how much agreement there was between those ratings. If a subject was rated with 1s and/or 2s, he or she would show up as part of this graph. The thin line is what we would expect from random assignments (given certain assumptions), and the darker line is actually one dot per observation. The vertical and horizontal components are perfect agreement--the subject got either all 1s or all 2s from all raters. The diagonal part is where the ratings are mixed, e.g. a 1 and a 2 or two of each.
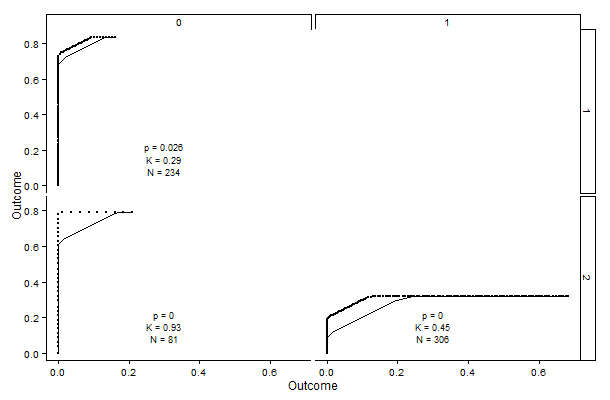
The p-value is for a hypothesis test of the data against the null hypothesis of random assignments. Kappa is a computation very similar to Fleiss--it represents the available agreement beyond chance that we see here. So for the lower right graph, 45% of the possible 'extra' agreement is observed. Perfect agreement, with K=1, would look like an inverted L.
The program is designed to work with three types of data. Follow the on-screen guides to loading.You'll need it in CSV format, which is easy from Excel.
I started a wiki on the GitHub page.


No comments:
Post a Comment